---
title: "Sampling"
author: "Evan L. Ray"
date: "October 4, 2017"
output: ioslides_presentation
---
```{r setup, include=FALSE}
knitr::opts_chunk$set(echo = FALSE)
require(ggplot2)
require(dplyr)
require(tidyr)
require(readr)
```
## The Course So Far
Describing a data set:
| Variable Type(s) | Plot | Description/Model |
|-------|------|-------------------|
| 1 Categorical | Bar | (Marginal) distribution |
| 2 Categorical | Bar | Joint Distribution, Conditional Distribution |
| 1 Quantitative | Histogram or Density | mean, median, quantiles, standard deviation, variance, IQR, normal model |
| 2 Quantitative | Scatter Plot | correlation, linear model |
| 1 Categorical, 1 Quantitative | Density Plot or Box Plot | summary statistics of the quantitative variable for each level of the categorical variable; model later in this course or future classes |
## Goal for the rest of the class
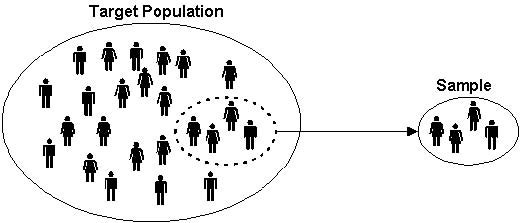
* **Use data from a Sample to learn about a Population**
 ## Goal for the rest of the class
* **Use data from a Sample to learn about a Population**
* Example:
* **Question**: How many cats does the average household have?
* **Population**: households in the United States
* **Sample**: a few chosen households
* **Population Parameter**: a number summarizing the distribution (in the population) of values for a particular variable (mean number of cats across all US households)
* **Sample Statistic**: a number summarizing the distribution (in the sample) of values for a particular variable (mean number of cats in the households in our sample)
* Our Hope: The sample statistic will be a good guess of the population parameter.
## How Do We Get Our Sample?
## Goal for the rest of the class
* **Use data from a Sample to learn about a Population**
* Example:
* **Question**: How many cats does the average household have?
* **Population**: households in the United States
* **Sample**: a few chosen households
* **Population Parameter**: a number summarizing the distribution (in the population) of values for a particular variable (mean number of cats across all US households)
* **Sample Statistic**: a number summarizing the distribution (in the sample) of values for a particular variable (mean number of cats in the households in our sample)
* Our Hope: The sample statistic will be a good guess of the population parameter.
## How Do We Get Our Sample?
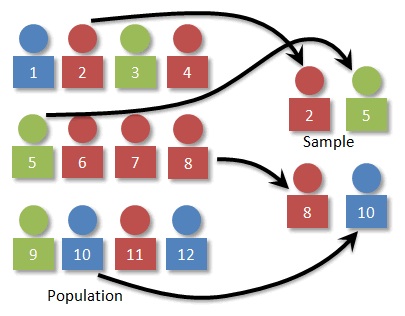
Simple Random Sample
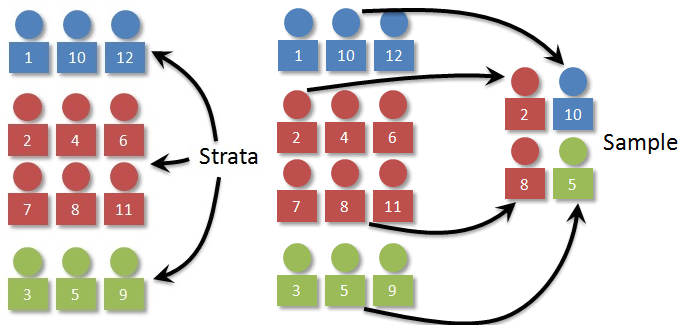
Stratified Sampling
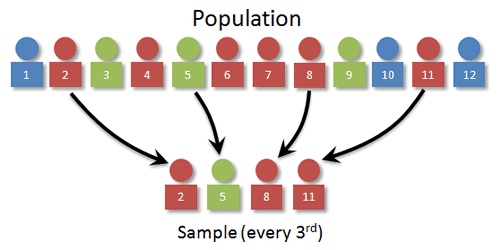
Systematic Sampling
Cluster Sampling
