Stat 140 HW#7: SDM4 Chapters 18 – 20
Your Name Goes Here
November 20, 2017
This homework is due at the start of class on Monday, November 20th.
PRACTICE PROBLEMS (not to be turned in; may be helpful for exam review):
SDM4 18.1, 18.3, 18.5, 18.7, 18.9, 18.11, 18.13, 18.15, 18.17, 18.19, 18.23
SDM4 19.1, 19.3, 19.5, 19.9, 19.11, 19.13, 19.15, 19.17, 19.19, 19.21, 19.25, 1927, 19.33, 19.35, 19.39, 19.41
SDM4 20.1, 20.3, 20.7, 20.11, 20.13, 20.15, 20.17, 20.19, 20.21, 20.23, 20.25, 20.27, 20.29, 20.31, 20.35
PROBLEMS TO TURN IN:
SDM4 18.4 (Single moms)
In a 2010 Pew Research Study on trends in marriage and family, 4% of randomly selected respondents said that the trend of more single women having children is “a good thing.” The 95% confidence interval is from 2.9% to 5.1% (n = 1229). Interpret this interval in the context of this problem. As part of your interpretation, explain the meaning of 95% confident in this context.
SOLUTION:
SDM4 18.20 (Mislabeled seafood)
In December 2011, Consumer Reports published their study of labeling of seafood sold in New York, New Jersey, and Connecticut. They purchased 190 pieces of seafood from various kinds of food stores and restaurants in the three states and genetically compared the pieces to standard gene fragments that can identify the species. They found that 12 of the 22 “red snapper” packages tested were a different kind of fish.
- Are the conditions for creating a confidence interval satisfied? Explain.
SOLUTION:
- Construct a 95% confidence interval.
SOLUTION:
# Your code goes here. Use the binom.test function- Explain what your interval says about “red snapper” sold in these three states.
SOLUTION:
SDM4 19.38 (Acid Rain)
A study of the effects of acid rain on trees in the Hopkins Forest shows that 25 of 100 trees sampled exhibited some sort of damage from acid rain. This rate seemed to be higher than the 15% quoted in a recent Environmetrics article on the average proportion of damaged trees in the Northeast. Does the sample suggest that trees in the Hopkins Forest are more susceptible than trees from the rest of the region? Comment, and write up your own conclusions based on an appropriate confidence interval as well as a hypothesis. Include any assumptions you made about the data.
SOLUTION:
# Your R code goes here. Use the binom.test function.SDM4 20.4 (t-models)
- Using the
qtfunction in R, estimate the critical value of t for a 95% confidence interval with df=7. You may find it helpful to take a look at the “manual” computation of a confidence interval for a mean in the slides from Friday, Nov 10 – there is an example of a similar calculation there.
SOLUTION:
# Insert a call to qt() here.- Do the same for a 99% interval with df=102.
SOLUTION:
# Insert a call to qt() here.SDM4 20.48 (Wind power)
Should you generate electricity with your own personal wind turbine? That depends on whether you have enough wind on your site. To produce enough eergy, your site should have an annual average wind speed above 8 miles per hour, according to the Wind Energy Association. One candidate site was monitored for a year, with wind speeds recorded every 6 hours. A total of 1114 readings of wind speed averaged 8.019 mph with a standard deviation of 3.813 mph. You’ve been asked to make a statistical report to help the landowner decide whether to place a wind turbine at this site. The land owner says he doesn’t want to pay for the turbine unless there is conclusive evidence that the average wind speed is greater than 8mph. The following R chunk loads the data and makes some initial plots.
WindSpeed <- read_csv("https://mhc-stat140-2017.github.io/data/sdm4/Wind_Power.csv")## Parsed with column specification:
## cols(
## `wind speed` = col_double(),
## Time = col_integer()
## )names(WindSpeed) <- c("wind_speed", "time")
ggplot() +
geom_histogram(mapping = aes(x = wind_speed), data = WindSpeed)## `stat_bin()` using `bins = 30`. Pick better value with `binwidth`.
ggplot() +
  geom_point(mapping = aes(x = time, y = wind_speed), data = WindSpeed)
- Discuss the assumptions and conditions for using Student’s t inference methods with these data.
SOLUTION:
- What would you tell the landowner about whether this site is suitable for a small wind turbine? Please provide a full and comprehensive report including both a hypothesis test to answer the landowner’s question and a confidence interval for the mean wind speed at the site.
SOLUTION:
# Your code goes hereFraudulent Pizza Sizes
In 2012 a big Australian pizza chain, Eagle Boys, ran an advertising campaign saying their pizza was better than the competition’s pizza because it was bigger. They made several specific claims, and one of them was that the average size of their pizzas was greater than 12 inches. (You can see a screenshot of their website making these claims here: https://mhc-stat140-2017.github.io/data/jse/pizza/pizza_website.png). Interestingly, the company also provided the data to “back up” their claims. Let’s see how well the data support the claim that the pizza size is greater than 12 inches.
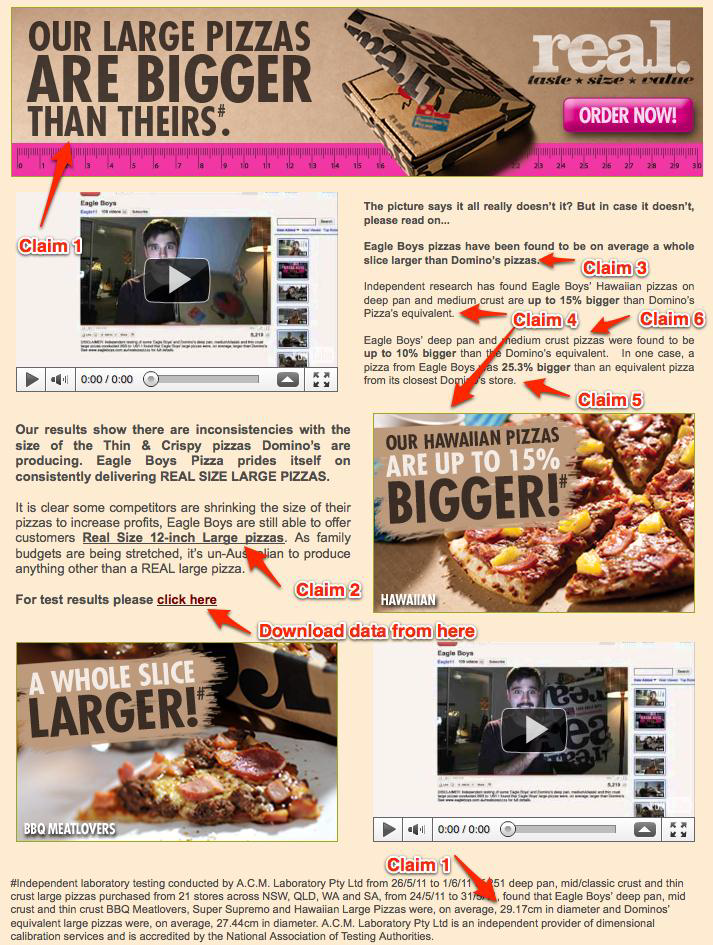
pizza <- read_csv("https://mhc-stat140-2017.github.io/data/jse/pizza/pizzasize.csv")## Parsed with column specification:
## cols(
## ID = col_integer(),
## Store = col_character(),
## CrustDescription = col_character(),
## Topping = col_character(),
## Diameter = col_double()
## )pizza_eagle <- filter(pizza, Store == "EagleBoys") %>%
mutate(diameter_in = Diameter * 0.39370079)- Evaluate the assumptions necessary for conducting inference about the mean diameter of Eagle Boys pizza.
SOLUTION:
# Your code goes here- Perform a hypothesis test from the point of view of an advertising executive wanting to demonstrate that the mean pizza diameter is greater than 12 inches. What do you conclude?
SOLUTION:
# Your code goes here- Perform a hypothesis test from the point of view of a skeptical consumer wanting to demonstrate that the mean pizza diameter is less than 12 inches. What do you conclude?
SOLUTION:
# Your code goes here- Obtain a 99% confidence interval for the mean pizza diameter. Interpret the interval in context.
SOLUTION:
# Your code goes here